 by Roger Martin-Fagg
Historical Background
The UK has always been a major trading nation and government has always been inextricably involved with this trade. We made a fortune out of wool exports to Europe (the manor houses of the Cotswolds, Essex and Suffolk built from 1500 onwards are testimony), then, from around 1760, manufacturing took over. Mercantilism was the basic policy imposed by Britain on its colonies.
Mercantilism defines a system where the government and merchants become partners with the shared goal of increasing political power and private wealth, to the exclusion of other empires. The government protected its merchants and excluded others by trade barriers, regulations, and subsidies to domestic industries in order to maximise exports from and minimise imports to the realm. It regulated and controlled all trade. The government spent much of its revenue on a superb Royal Navy, which not only protected the British colonies but threatened the colonies of the other empires, and sometimes seized them. The colonies were captive markets for British industry, and the goal was always to enrich the mother country.
The Stamp Act of 1765 was the first internal tax levied directly on American colonists by the British government. It imposed a tax on all paper documents in the colonies, and came at a time when the British Empire was deep in debt from the Seven Years’ War (1756-63) caused by France wishing to expand its colonies. It was swiftly followed by the Tea Act.
The Tea Act’s main purpose was not to raise revenue from the colonies but to bail out the floundering East India Company (which was jointly owned by merchants and landowners), a key actor in the British economy. The British government granted the company a monopoly on the importation and sale of tea in the American colonies. The colonists had never accepted the constitutionality of the duty on tea, and the Tea Act rekindled their opposition to it. Their resistance culminated in the Boston Tea Party on December 16, 1773, in which colonists boarded East India Company ships and dumped their loads of tea overboard. Parliament responded with a series of harsh measures intended to stifle colonial resistance to British rule; two years later the American War of Independence began.
A Corn Law was first introduced in Britain in 1804, when the landowners, who dominated Parliament, sought to protect their profits by imposing a duty on imported corn. During the Napoleonic Wars it had not been possible to import corn from Europe. This led to an expansion of British wheat farming and to high bread prices.
Farmers feared that when the war came to an end in 1815, the importation of foreign corn would lower prices. This fear was justified and the price of corn reached fell from 126s. 6d. a quarter in 1812 to 65s. 7d. three years later. British landowners applied pressure on members of the House of Commons to take action to protect the profits of the farmers (who were mostly tenants of the landowners). Parliament responded by passing a law permitting the import of foreign wheat free of duty only when the domestic price reached 80 shillings per quarter (8 bushels).
This legislation was hated by the people living in Britain’s fast-growing towns who had to pay higher bread prices. The industrial classes saw the Corn Laws as an example of how Parliament passed legislation that favoured large landowners. The manufacturers in particular were concerned that the Corn Laws would result in a demand for higher wages.
There was a dreadful harvest in 1816, which caused bread prices to increase rapidly. This was followed by widespread industrial unrest as workers insisted on higher wages in order to pay for their more expensive food – there were strikes and food riots all over Britain.
The Corn Laws, therefore, had an important political impact. This was demonstrated most clearly and bitterly by the Peterloo Massacre, which occurred at St Peter’s Field, Manchester, on 16 August 1819, when cavalry charged into a crowd of 60,000–80,000 that had gathered to demand the reform of parliamentary representation.
It took another 13 years for the Great Reform Act to grant voting rights to the new urban dwellers. The Corn Laws were eventually repealed in 1846 and ushered in a period of freer trade.
The next 40 years saw unprecedented growth in incomes and wealth. The UK became the largest economy in the world until the US overtook us in 1890. We were also the largest economy in Europe until Germany took over in about 1910. The reasons for this decline are many and varied. The one I favour is that the sons and daughters of the manufacturing elite luxuriated in their inherited wealth (the Edwardian Era), concentrated on the good life, and tried to ape the lifestyle of the landowners their forefathers fought against.
So, from 1910 onwards the UK’s wealth declined relative to others. From 1920 there were failed attempts to return to the age of mercantilism, then the 1930’s depression hit and first the US then the UK and Europe imposed tariffs and trade restrictions. Global growth suffered.
In 1948, 23 countries including the UK signed the GATT free trade agreement. By 1995 it had become the WTO with 162 members and covered 97% of world trade.
In 1951, 6 countries formed the European Coal and Steel Community (ECSC): Germany, France, Belgium, Luxembourg, Holland and Italy. The aim was to “make war not only unthinkable but materially impossible” which was to be achieved by regional integration, of which the ECSC was the first step. The Treaty would create a common market for coal and steel among its members which served to neutralise competition between European nations over natural resources, particularly in the Ruhr. This grouping developed into the EEC, and then the EU. We joined in 1973. Now it consists of 28 countries and 500m people, with three associate members: Iceland, Liechtenstein and Norway.
In 2015 the UK was the fifth largest economy on the planet, with exports accounting for 3.3%% of global exports, and imports amounting to 3.8%% of global. This places the UK as the sixth largest trader in the world, behind the US, China, Germany, Japan and France. It is the sixth largest importer and the seventh largest exporter.
The UK has relative strength in services exports compared to goods exports as it is the third largest services exporter behind the US and Germany, and only the tenth largest goods exporter.
Key large country competitors have a higher proportion of goods in their total exports – where goods account for 63% of UK exports, they account for 71 % of US exports, 79 % of French exports, and 85 % of German and Japanese exports.
The UK’s share of global services exports was 6.2 % in 2010, down from its peak of 8.7 % in 2004, but still over six times the UK’s share of the world population.
The UK’s share of global goods exports has declined steadily against the surge in goods exported from emerging markets, to 2.7 % in 2010. This is still around three times higher than the UK’s share of the world population.
How important is the European Union to UK trade and investment?
How large is the EU Economy?
Since its formation in 1993, the European Union (EU) has become larger than any individual economy in the world, with its GDP surpassing the USA’s for the first time in 2003. Despite this, the EU’s share of global GDP fell from 30% in 1993 to 24% in 2013. This is because growth in non-EU economies has outpaced growth of EU economies since the 1990’s, mainly driven by strong growth in the BRIC (Brazil, Russia, India and China) economies. Currently Brazil and Russia are contracting at 3% per annum, and China by my estimate is growing no faster than 3%. In the EU, Ireland is growing at 9%, Spain at 4%, Germany at 2%, France 1.5%, and Italy 1%. As EU banks become better capitalised I expect these growth rates to improve ( except Ireland!).
How important is the EU to UK trade?
The UK has traditionally held strong trade links with the EU. Despite changes in the composition of the global economy, the EU accounted for 44.6% of UK exports of goods and services in 2014, and 53.2% of UK imports of goods and services.
However, strong economic growth in many developing economies outside the EU has increased the importance of non-EU countries so the proportion accounted for by the EU has fallen consistently since 1999, despite the value of EU trade increasing.
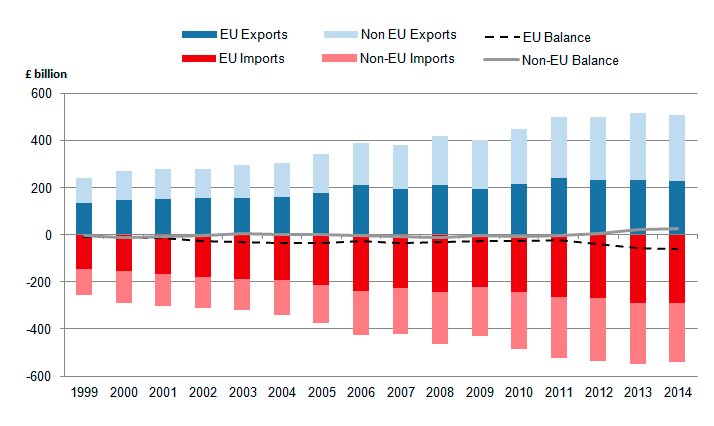
Exports from the UK to EU and non-EU countries grew on average by 3.6% and 6.5% respectively in each year between 1999 and 2014.
However, the stronger export growth to non-EU countries resulted in the proportion of UK exports destined for the EU falling from 54.8% in 1999 to 44.6% in 2014 the latest year of data we have.
Growth in the value of UK imports of goods and services from EU and non-EU countries is more comparable, increasing by an average of 4.7% and 5.5% respectively in each year since 1999.
Faster growth in the value of UK imports from compared to exports to the EU has resulted in the UK’s overall trade balance with the EU deteriorating (so the value of imports exceeds that of the exports), with the trade deficit widening notably, reaching £61.6 Bn in 2014 compared with £11.2 Bn in 1999, as shown by the black dotted line in Figure 1, below.
UK trade with the EU is dominated by goods rather than services; in 2014, trade in goods represented close to two-thirds of all UK exports to the EU, and over three-quarters of total UK imports from the EU. Between 1999 and 2014, goods imported by the UK from the EU have risen by 4.9% per year on average, compared to exports which have risen by 2.5% per year, causing the UK’s trade in goods deficit with the EU to rise to £77.0 Bn.
Although the UK has historically recorded a trade in goods deficit with the EU, the trade in services statistics are much more favourable, running a surplus in each year since 2005 which reached £15.4 Bn in 2014.
UK exports of goods and services to non-EU countries have grown at a faster rate than imports, driven largely by the services side. This has resulted in the UK running an overall trade surplus with non-EU countries (where the value of exports exceeds that of imports) over the past three years, which reached £27.8 Bn in 2014, as shown by the grey dotted line in Figure 1:
Figure 1
How important is the EU for UK foreign direct investment?
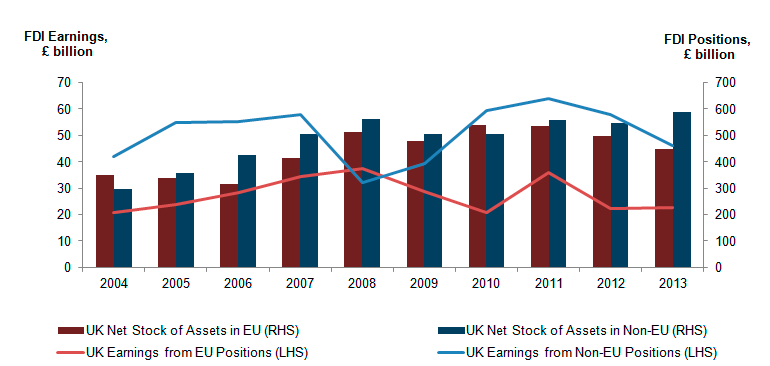
Between 2004 and 2013, the net stock of assets held by UK residents and businesses overseas grew by an average of 5.4% per annum, but this was outpaced by growth in the net stock of assets held by overseas residents and businesses in the UK, which rose by an average of 11.6% per annum. This resulted in the UK’s net position with the world – that is, UK net assets held overseas minus net overseas assets held in the UK – declining by an average of 15.9% per annum over the same period.
Within these totals, the EU remained both a major investor in the UK and a major recipient of UK investment; in 2013, 43.2% of UK overseas assets were held in the EU, whereas 46.4% of assets held in the UK by overseas residents and businesses were attributable to the EU.
The 2013 figures reflect a decline in the proportion of total stock of assets held by UK residents and businesses in the EU, which has fallen from 51.6% in 2010. These movements reflect the challenging economic environment in the EU at the time, but are likely to improve in the near future. As seen in Figure 2, the earnings the UK receives from its net stock of assets held in the EU has struggled to recover since the 2008-9 economic downturn. In contrast, the return on investment from non-EU countries did recover, although began to decline again in 2012.
Figure 2: UK net stock of assets held overseas and earnings received
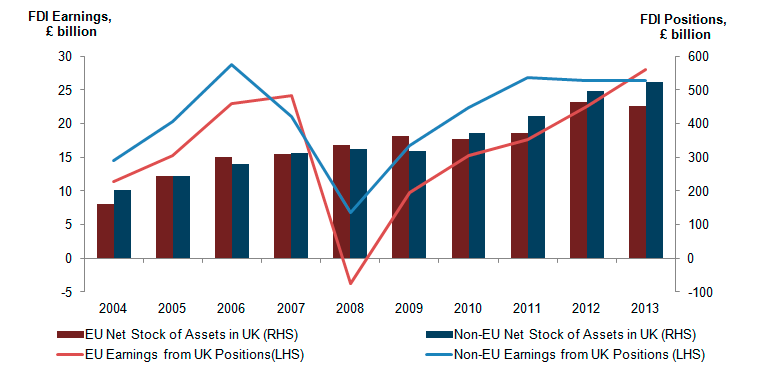
In terms of overseas investment into the UK, the proportion of net assets held in the UK by EU residents and businesses has fallen from 53.2% in 2009 to 46.4% in 2013. As seen in Figure 3, this decline does not reflect a contraction in the value of net assets held by the EU in the UK – which has risen by 24.8% since 2009 – but rather a proportional change due to a larger increase in the value of UK based assets owned by non-EU residents and businesses, which rose by 64.1% over the same period.
The relative strong growth in the stock of net assets held in the UK by non-EU countries has resulted in their value exceeding the EU’s stock in 2010. This recent development may reflect how, between 2008 and 2011, earnings received by non-EU countries from their UK based assets recovered more favourably compared to EU assets relative to their respective pre-downturn peaks. More recently, EU earnings have risen since 2012 and surpassed their pre-downturn peak in 2013.
However the UK is only behind the US(no.1) measured by inward investment values.
Figure 3: Overseas net stock of assets held in the UK and earnings received
The growth in the value of net assets held by EU and non-EU residents and businesses in the UK outpaced growth in the value of UK net assets held overseas, therefore the UK’s overall net position compared to the ROW deteriorated.
Between 2010 and 2013, the UK’s net position with the EU fell from a surplus of £185.9 billion in 2010 to a deficit of £5.1 billion in 2013, and from a surplus of £134.6 billion to a surplus £64.7 billion with non-EU countries. This deterioration reflects both a reduction in the number of assets held by UK residents and businesses in the EU, and an increase in the value of assets held by EU and non-EU residents and businesses in the UK.
In summary, the UK runs a trade deficit with the EU but a trade surplus with the rest of the world. The EU accounts for a diminishing proportion of UK overseas trade.
The UK is the second largest exporter of services behind the USA. Services only account for 20% of world trade but 50% of UK exports.
The UK has trade surpluses with the world in the following sectors:
Transport
Communications
Education
Entertainment
Publishing and Information Services
Public Relations
Management Consulting
Retailing
Engineering Services
Law and Accountancy
The UK has a trade surplus in every service sector except Tourism.
Cars and Pharma are the UK’s biggest manufacturing exports but overseas sales of business services are 50% larger than either!
The biggest customers for our services exports are the USA, Saudi Arabia and Ireland. The Netherlands and Switzerland are also big customers, but not necessarily the final consumers.
We are net importers of services from India, the Philippines, and Pakistan.
Economic growth is about adding value to raw materials and intellect. We have almost no raw materials, thus we must add value to brain power. Trade allows the increasing specialisation of labour and is not a zero-sum game – it allows countries to become rich trading those activities in which they have comparative advantage. We buy Audi cars from Germany, but their gearboxes are all designed near Banbury. We buy tools, toys, and assembled electronic items from China; we sell them asset management, engineering advice and Downton Abbey. Globally, services tend to be purchased at a national level and so World Trade Organisation (WTO) agreements have emphasised the trade in goods to the disadvantage of the UK.
To date the EU has done a great deal to facilitate trade in goods (where Germany has a comparative advantage because of higher rates of innovation and a culture which values engineers and pays them accordingly). The evidence very strongly suggests that the increase in trade openness of the UK, associated with EU membership, has been greater than the global economic trend. Trade costs have fallen faster in the EU than internationally and the flow of trade between the UK and its partners has grown faster than might be expected based on size and proximity. There has been little progress in developing a single market in services. However this remains an aspiration and when it happens, assuming the UK is part of its development, it is probable we will enjoy an overall trade surplus with the EU driven by exports of services in ten years time.
In or Out of the EU
It must be stated upfront that it is very difficult to quantify the impact of an ‘out’ decision both in the short run and over a longer period. I will outline some possible scenarios based on how people tend to behave during periods of significant change, but first some more background:
Article 50 of the Lisbon Treaty provides that the EU will negotiate a new agreement with any withdrawing country over two years. This can be extended but only by unanimous agreement from the remaining members. The withdrawing country has no say at all on the terms and conditions of exit.
The EU electorate are currently disillusioned with Brussels, evidenced by voters supporting the rise of nationalist parties in France, Germany, Italy and the Netherlands. It is likely the EU will be desperate to show that a decision to leave is painful so as to discourage others.
The dominant issue for the UK is how to maintain access to the world’s biggest market if no longer in the club. There has been a lot of comment on the Canadian Trade deal. Here are some of the details.
Canada has just completed a free trade deal with the EU but as yet it has not been ratified by the EU Parliament. It took 7 years to negotiate. Canadian negotiators sought to have EU tariffs eliminated for export industries in which Canada has a comparative advantage: forest products, information technology, chemical and plastic products, automobiles and certain agricultural sectors (pork, beef, seafood).. The immediate elimination of 98% of all EU tariffs (both industrial and agricultural), and almost all tariffs within seven years, should help Canada decrease its declining net export trade with the EU.
Canadian goods will also benefit from non-tariff barriers on the basis of the requirement to be accorded national treatment within the EU – meaning that they should be treated equally to local goods on regulatory issues applicable both at the border and once imported into the EU territory.
The EU pushed for strict rules of origin so as to prevent the deal becoming a way for U.S. exporters to indirectly access the European market. Although the details are not finalized, it appears that the EU has actually conceded to be more flexible on this. With respect to automobile exports, Canadian cars eligible for the tariff benefit will be required to have 50% Canadian content for the first seven years and 55% Canadian content once tariffs drop to zero. Canada was also able to secure what is effectively a waiver of EU rules of origin for up to 100,000 automobiles per year. In turn, Canada has agreed to recognise a list of 17 EU car standards as comparable to its own, with a commitment to further harmonisation of standards in the future.
The World Trade Organisation (formerly GATT)
The EU speaks with one voice in the WTO. Every EU country is a WTO member in their own right but work together to act as a single bloc. The EU itself is also a member.
The European Commission negotiates at the World Trade Organisation on behalf of the EU. The Commission coordinates with the EU Member States through the Trade Policy Committee and conducts EU policy following guidelines set down by the Member States in the Council of Ministers.
The Commission also regularly informs the European Parliament of key WTO issues. When an agreement is negotiated at the WTO, the Commission needs the formal authorisation of the Council and European Parliament to sign the agreement on behalf of the EU.
Currently the EU has trade agreements with 53 countries, covering 45% of world trade, and is actively negotiating with China, India and the USA.
A key consideration is how the UK would maintain access to these markets if we left the EU. If we leave, all these existing EU-negotiated arrangements would lapse. We cannot be sure of the impact but it will be disruptive, it may result in higher prices, it may reduce market access.
Below are some alternative models of engagement with the EU.
The Norwegian Model
Norway has full access to the single market through their membership of the European Economic Area. They are obliged to observe all EU regulations, to make payments to the EU budget (currently around 90% of Britain’s net payment per head). They have to abide by the four freedoms of goods, services, capital and labour. Consequently there are 13 EU workers per 1000 in Norway, compared to 2.7 in the UK. The total immigrant population in Norway is 15.6%. It is 11.9% in the UK.
The Swiss Model
Switzerland is not in the EEA. It has negotiated bilateral agreements which give it access to EU goods markets but only a few services. It has to abide by single market rules, contribute to the EU budget and accept the free movement of people. The Swiss have 7 EU workers per 1000, and 24% of its population are foreigners. In February 2014, 50.3% of the Swiss voted to limit mass migration. The EU has warned the Swiss that banning EU workers will result in the end of their trade agreement.
The Main Brexit Arguments
Britain is the fifth largest economy in the world. In 2014 we purchased £288 Bn worth of mostly goods from the EU. We sold them £227 Bn worth. Both sides have a vested interest in a trade deal. But this is unlikely to cover services, where we have a comparative advantage, so the numbers suggest they need us more than we need them. This is a false assertion. Britain accounts for 10% of EU exports, but the EU accounts for 46% of Britain’s. Britains’ biggest trade deficit is with Germany and Spain. Any trade agreement must be endorsed by all 27 members.
Argument 1: If Britain leaves, new trade deals could be struck quickly and easily.
This might be possible but the newly formed ASEAN group are more likely to negotiate with 500m potential consumers than 64m. If the negotiators represent 500m they have much more bargaining power than 64m.
The ASEAN members agreed this year to a single market which will ensure the free flow of goods, services, investment, and skilled labour. The members are Myanmar, Laos, Thailand, Cambodia, Malaysia, Singapore, Indonesia and the Philippines.
Argument 2: If Britain leaves the EU, the red tape which strangles UK businesses will
disappear.
The OECD reports that the UK is one of the most lightly regulated product and labour market economies. The rules and regulations which cause the biggest problems are all home grown, e.g. planning, environmental and the living wage. We would have to untangle 1200 separate EU regulations which are integrated into UK law. This would take at least ten years.The lawyers will love it!
To trade with the EU we would still have to conform to all their technical standards (which are now being steadily adopted by the rest of the world).
Argument 3: If Britain leaves the EU, the free movement of people can be stopped and we can regain control of our borders.
In 2014, 91.6% of the British were from Britain, 4.6% were from the EU, and 3.8% from the rest of the world. Net migration in 2014 was 339,000, of which 201,000 were from the EU and 138,000 from the rest of the world. 25% of immigrants came from the Commonwealth.
The free movement of people is a key tenet of the EU. It is likely that full access to the EU market will not be granted if we limit movement (as per the Norwegian model). And government income will fall because studies both by Government and independent firms show that EU immigrants are net contributors to the Exchequer.
Additionally the NHS will face even greater shortages of key workers and our care homes will also face recruitment problems. Today there are sufficient vacancies for every unemployed person (see chart on final page). Unemployment is 760,000. Britain is at full employment. The only way to solve this problem is to immediately raise the retirement age to 70 and make the British work longer.
How Eurosceptic are the Europeans?
Below are the results of previous EU referendums. The results imply that the French, the Dutch, the Danes and the Irish are not particularly inclined towards ever closer union, nor do they like the Euro very much. One can guess that if the Germans were allowed a referendum the results would be similar. The evidence suggests that the UK is not a lone voice against ever closer union and some of the apparent excesses of the system.
1992 Denmark 50.7% against Maastrict
1992 France 51.1% for Maastrict
1992 Switzerland 50.3% against EEA membership
2000 Denmark 53.2% against joining the Euro
2001 Ireland 53.9% against the Treaty of Nice
2003 Sweden 56.1% against joining the Euro
2005 France 54.9% against an EU constitution (which would have reduced sovereignty and demanded ever closer union)
2005 Netherlands 61.5% against the EU constitution
2008 Ireland 53.2% against the Treaty of Lisbon
NB the Irish were told to vote again in 2001 and 2008, and both results were reversed!
How Undemocratic is the EU?
The European Parliament is the second largest in the world with 751 members. Britain has 73 members. The elections are every 5 years and there are about 390m eligible voters.
Legislation can be initiated by the Commission (the civil service), the Council of Ministers (one from each member country), and the Parliament. The European Parliament used to be an expensive talking shop with limited powers, but successive treaties have made it one of the most powerful legislatures in the world. Its power now equals that of the Council of Ministers, which can initiate legislation using qualified majority voting for some types, but requires unanimous agreement for others. It then has to be ratified by the Parliament.
The Commission can present a proposal to Parliament and the Council which will only become law if both agree on a text, which they do (or not) through successive readings up to a maximum of three.
In its first reading, Parliament may send amendments to the Council which can either adopt the text with those amendments or send back a “common position”. That position may either be approved by Parliament, or it may reject the text by an absolute majority, causing it to fail, or it may adopt further amendments, also by an absolute majority. If the Council does not approve these, then a “Conciliation Committee” is formed.
The Committee is composed of the Council members plus an equal number of MEPs who seek to agree a compromise. Once a position is agreed, it has to be approved by Parliament, by a simple majority. This is also aided by Parliament’s mandate as the only directly democratic institution, which gives it greater control over legislation.
It is false therefore to describe the current arrangements as undemocratic. It is true only to say the British electorate choose not to exercise their democratic right: In 2014 only 35% turned out and voted. The EU average was 42%
EU Law
The doctrine of the supremacy (sometimes referred to as primacy) is a principle which states that when there is conflict between European law and the law of Member States, European law prevails; the norms of national law have to be set aside. This principle was developed by the European Court of Justice and, as interpreted by that court, it means that any norms of European law always take precedence over any norms of national law, including the constitutions of member states.
Although national courts generally accept the principle in practice, most of them disagree with this extreme interpretation and reserve the right, in principle, to review the constitutionality of European law under national constitutional law. The UK tends to accept the principle, some other countries less so.
EU Regulations become part of national law as soon as they’re passed by the European Parliament but EU countries must pass their own laws to put directives into practice. The UK has a reputation for copper plating directives and embodying them in UK law, some other countries view the directives in a more advisory capacity. Either way, the UK does not need to leave the EU in order to request that its national legislators take a less stringent approach to the enshrining of EU directives in law.
The possible Brexit scenarios
The market for goods
The principle of non-discrimination requires WTO members not to treat any member less advantageously than any other; grant one country preferential treatment, and the same must be done for all others. There are exceptions for regional free trade areas and customs unions like the EU, but the principle implies that, outside of these, the tariff that applies to the ‘most-favoured nation’ (MFN) must similarly apply to all.
In practice, this would prevent discriminatory or punitive tariffs being levied by either the EU on the UK, or vice versa. The maximum tariff would be that applied to the MFN. The EU’s MFN tariff has fallen over time, meaning that in this particular context the ‘advantage’ of membership has declined. On a trade weighted basis the MFN is 1.5% (please view this as an average).
However, given that MFN tariffs would be imposed on around 90% of the UK’s goods exports to the EU by value, it would necessarily mean many exporters becoming less price competitive, to varying degrees, than their counterparts operating within the remaining EU, and those within countries with which the EU has preferential trading relationships.
Similarly, because the UK has negotiated as part of the EU at the WTO, it is likely that it would inherit the EU’s tariff regime at the time of leaving, meaning, at least initially, higher prices would be faced by consumers buying imports from the EU and those countries with which the EU has a trade agreement.
Without any change, a 32% tariff would be levied on imports of wine (surely this is a reason to vote in!), and a 9.8% tariff on motor vehicles. The implications of a move to an MFN trading arrangement for exporters and domestic consumers would vary considerably by sector.
For instance, without a trade agreement, a tariff of 4.1% would be applied to liquefied natural gas exports from the UK to the EU; a tariff of 12.8% to wheat and meslin (a type of flour), and a tariff of 6% to unwrought aluminium, all items which the UK currently runs a trade surplus with the EU. There would be a 12.1% tariff on goods vehicles, and 3.8% on car components. In all, 1200 types of goods would be affected to varying degree.
The market for services
Obstructions to services trade are usually in the form of non-tariff barriers, such as domestic laws and regulations, also known as ‘behind the border’ measures. In general, services markets are more highly regulated than the market for goods. Often, regulation is intended to meet social objectives, or to correct failures in supply, rather than to directly restrict foreign suppliers, but the effect on market access for foreign companies can in some cases be highly restrictive.
EU Member States retain considerable national discretion over services regulation and supervision. Just as a fully level playing field in services trade does not exist within the EU, so exporters from outside the EU face different levels of market access in individual Member States.
However, the level of market access would generally be far more limited for UK exporters under a General Agreement of Trade and Tariffs (GATS ) arrangement than it is currently for a number of reasons:
1) Many restrictions that are forbidden within the EU remain applicable to firms outside the
EU because Member States have made no commitments under the GATS schedules in
those areas.
2) The EU (unlike the GATS) has pursued the harmonisation of regulation and supervision in
several large services sectors, thereby taking away the justification of Member States to
insist on national regulation in this respect.
3) The right of commercial establishment is guaranteed under EU treaties, significantly facilitating
trade in services provided via the commercial presence of a foreign firm. Similarly,
the free movement of labour facilitates trade in those services provided through the
presence of people in the territory of another economy.
4) EU competition policy prevents, to an extent, barriers to services trade arising from incumbent
firms benefitting from excessive market power.
5) The Treaty rights with respect to free movement of services, freedom of establishment,
and free movement of labour are enforced supranationally by the Court of Justice of the
European Union, underpinned by extensive case law on services exchange.
Under GATS, an independent panel can be appointed to settle and enforce disputes, but there is no presumed right of market access; the job of the panel is merely to assess whether the barrier in question is non-discriminatory. As well as affecting cross-border trade in services, these restrictions could also have implications for UK companies providing services through a commercial presence (effectively outward direct investment) in other Member States.
The EU treaties require that a service provider from one Member State be legally free to establish in another, while continuing to regulated by the authorities of its home country. A UK company that provides services through establishments in other Member States may find, if Britain is no longer a member of the EU, that it has to comply with the requirements of a foreign regulatory authority.
The Transatlantic Trade and Investment Partnership (TTIP)
This is a trade deal between the USA and the EU which has been conducted in secret. The ongoing discussions are about market access, specific regulation, and broader rules for cooperation. The biggest concern which has gained much publicity is the proposed Investor-state dispute settlement (ISDS). This is an instrument that allows an investor to bring a case directly against the country hosting its investment, without the intervention of the government of the investor’s country of origin. The fear is a US health services company could be awarded a contract to supply e.g. the NHS, and then the US investors claim the return is less than promised and so sue the NHS, or indeed the government, with any fees payable by taxpayers. But as so much of the deal is still confidential, this cannot be proved.
What will happen if Britain votes to leave?
The following scenario is my opinion based on history and current institutional arrangements. It is not written to be deliberately alarming, rather it is designed to be a reasonable economic analysis with some political consequences. But as you know economists are famous for getting things wrong!
As soon as the vote is announced and it is to leave, the forex dealers will sell sterling (they may well have been doing this in the weeks before the vote). The hedge funds will see the decline as a one way bet and very quickly sterling could hit $1.25 and €1.08.
In July the Government will fail to sell £10Bn of gilts at 2% (in January the gilts sale was only 1.1 x oversubscribed – normally it is covered up to 6 times). This will raise the long run interest rate to around 4%. The mortgage rate will respond immediately and mortgages will increase by 2% overnight. The housing market will shudder to a halt and prices will stop rising. It is possible but unlikely that prices will crash.
Assuming sterling does not recover from the rates predicted above, the UK inflation rate will rise to 3% by Jan 2017. The Bank of England will raise base rate to 2% by March 2017.
Cameron will resign. Boris, Gove and Duncan-Smith will claim the moral high ground, and one supposes a bid for the leadership.
By September 2016, retail sales will have stopped dead and the papers will be full of misery. Finance directors will begin to conserve cash as a recession begins. As government revenues collapse there will be an emergency budget in November with much deeper cuts in public spending than anyone expected, due to the soaring interest bill on the national debt.
As the Balance of Payments deficit continues to widen to 5% of GDP (due to a weak currency) the Treasury will argue that domestic demand must fall further as exports are not responding to lower prices.
In May 2017 unemployment will begin to rise and there will be a mass exodus of EU workers to a strongly recovering Europe.
This recession lasts three years. By the end of 2017 the Tories lose their working majority. Scotland demands another referendum and in 2019 they vote to leave the UK and apply to join the EU.
Out of desperation, the UK is forced to do deals with the EU which are against its long term interest, but access to the market is regained (with the abolition of controls on EU workers). The Conservatives lose the 2020 election, the incoming Labour government has a majority of 5 with the SNP holding the balance of power. Yvette Cooper, the first female Labour UK PM, causes concern by appointing her husband as Chancellor of the Exchequer.
Points to bear in mind
It is companies not countries which trade with each other. Almost all countries have at least one world class local company, but it is like to be small and selling into global niches.
British companies prefer to trade with the old colonies or where culture and language is common. We have only a few large manufacturing businesses which possess a comparative advantage. We have many smaller companies with price premium niches (but whose owner-managers often avoid countries where the food is poor, or there is no sailing or skiing which they can combine with a business trip). These companies depend on highly skilled engineers, designers and IT specialists from around the world.
British exports are mostly premium priced, a lower exchange rate does not increase volumes by much if at all. It does however increase the profit margin.
We have significant comparative advantages in services. After the US, Europe is the biggest global market for services.
It takes a long time to establish a presence in new markets unless you are selling clearly differentiated goods on the internet.
So what should you do if you run a UK based business?
If you are exposed to currency risk, buy forward now.
As a precaution make sure you have banking arrangements which will allow you to survive a cash shortfall. Or begin to build a cash position.
Distribute this paper to all your employees; do not tell them how to vote but emphasise how important the vote is.
Try and avoid getting angry with the political debate (that is unless the quality improves). If you find that you disagree with this paper then do your own research and see if you can refute its content. The first place to start is fullfact.org.
Sources:
The House of Commons Library
The FT
The Economist
The Bank of England
The ONS
https://fullfact.org/ I fully recommend this site. It checks the veracity of political utterances.
Published March 17 2016
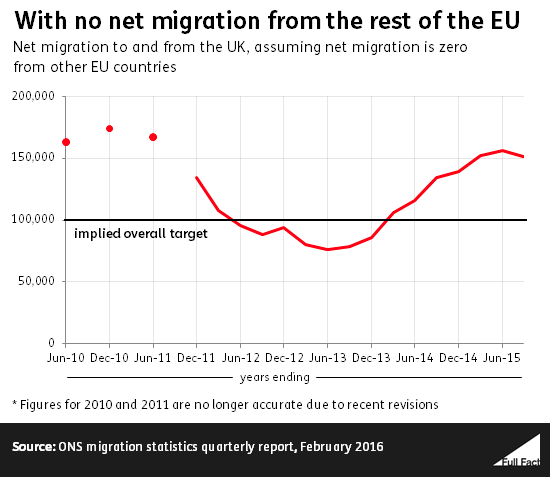
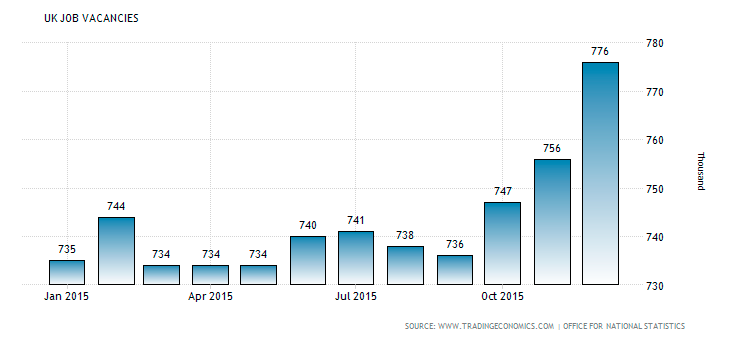
The first graph shows net migration with zero migrants from the EU, compared to the Governments target. The second the number of declared vacancies. Beware the scale exaggerates!
Follow our social channels here: