by Roger Martin-Fagg
Fake news is currently a popular term used by individuals who do not accept information, usually because it fails to support their opinion. A key component of behavioural economics is confirmation bias: we seek data to support our opinions. There are lies, damned lies and statistics. Economic data is used carelessly by many, sometimes with a deliberate attempt to deceive, but more often than not it is confirmation bias at work.
Here are some examples:
- The UK economy is doing well because we voted to leave the EU.
- Most (young) people cannot get on the housing ladder because there are insufficient houses and they are too expensive.
- A devaluation boosts exports.
- The population of the NE of England are 25% less productive than those in the SE.
- Our hospitals are overcrowded and stretched because of immigrants.
- The FTSE100 is at record highs because of outstanding leadership which justifies high rewards.
I would like to take each of these in turn and look at the evidence for them.
1. The UK economy is doing well because we voted to leave the EU.
The UK economy is growing slightly less than the long run annual trend of 2.4%.
The chart below shows quarterly change in GDP in real terms. It is reasonable to state that the recession ended around the second quarter of 2013, and since then there has been a
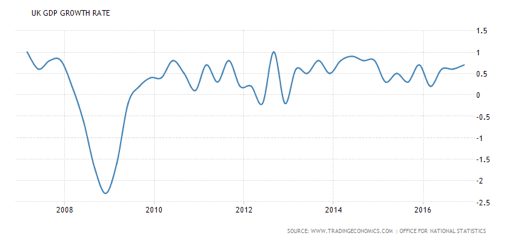
continuous expansion. Since 1955 the trend quarterly growth rate has been 0.6%. The typical business cycle has a duration of 7 years. We are therefore in year four of an upturn. This would suggest steady growth until 2020 when the cycle will turn down for a couple of years. The only events which can undermine this progress are a sharp and sustained increase in the price of oil, conflict in or between the major economies, a banking crisis, a currency crisis, or a significant fall in perceived wealth (due to any of the aforementioned).
If we ignore the institutional changes which will take place over the next 10 years for a moment and look at the fundamentals, we see a typical cyclical upturn driven by strong growth in M4 money supply. Dec 2016 data shows continued expansion.
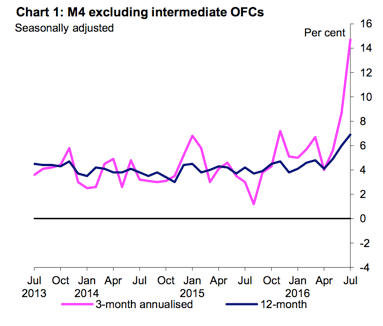
Typically Nominal GDP follows M4 expansion with a minimum lag of 6 months. The lag depends on confidence and asset prices, both of which drive the velocity of this new money. This growth in money supply sits in household and business accounts, but not for long as it gets spent almost immediately if confidence is high.
This money has boosted real wages. Record low interest rates boost household discretionary income which has been spent not saved.
House price growth at 7.2% year on year plus increases in share prices have boosted household wealth.
However the biggest contributor to growth in Q4 2016 was net trade. The devaluation of sterling reduced the flow of imports and boosted the flow of exports, particularly to non-EU countries. This performance counters the argument (often used by me!) that UK exports are not particularly price sensitive because they are mostly premium priced. I would suggest that the increase in exports is because the main economies of the world are growing better than forecast. But if this trend continues, all well and good.
The strong growth in incomes and retail sales has boosted government revenues above expectations. This means Chancellor Hammond is £12Bn better off than expected but he will want to bank it rather than give anything away in the upcoming budget.
2. Most (young) people cannot get on the housing ladder because there are insufficient houses and they are too expensive.
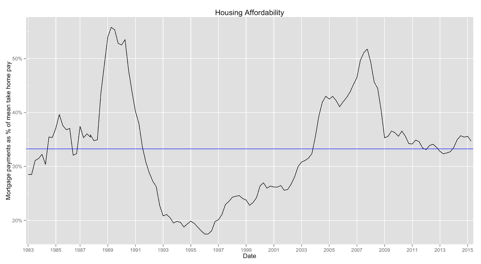
Housing affordability is at the same level as 2003. The median income of the first time buyer is £42K, the average house price is £219K. If we strip out London then the average house price is 4.2x household income. This is the long run average multiple. House prices continue to rise because help to buy is allowing first time buyers to obtain a sufficient deposit.
However there is a supply issue. New build is running at around 160,000 units, below the 200,000 estimated demand.
As always the distribution of incomes is the determinant of first time buyer profiles. The majority are in the top two quintiles. The average age is 30. The chart is 2016 data.
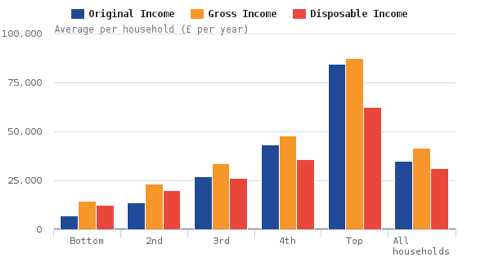
The data shows us that young people can afford to buy (outside London) if they choose to. The millennials choose to spend 15% of their after tax income on entertainment and eating out (source ONS social survey). We can conclude that outside London houses are affordable for those who choose to buy.
3. A devaluation boosts exports
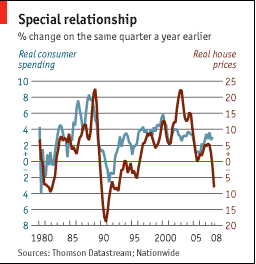
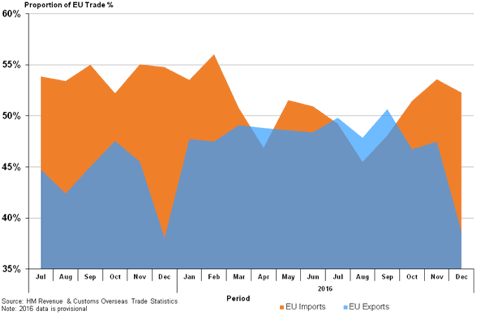
Evidence suggests that demand for UK exports is relatively static. UK exports have become less price competitive as we’ve moved away from low-cost manufacturers to a variety of services and high-tech manufacturing; these goods tend to have relatively few close substitutes. Therefore, even if the price falls, the increase in demand is relatively low. Similarly, demand for imports is relatively inelastic, so we continue to pay the higher price. The pound lost 25% of its value between 2008 and 2013. The current account did not improve. The chart is for 2015-16.
4. The population of the NE of England is 25% less productive than that in the SE.
What is productivity? Productivity generally refers to how efficiently inputs (labour and capital) are used to produce outputs (goods and services). Productivity is important as it is directly linked to living standards – a country’s ability to improve its standard of living over time depends almost entirely on its ability to raise its output per worker.
Labour productivity is usually expressed as a ratio of units of output, often Gross Domestic Product (GDP) or Gross Value Added (GVA), to units of input (employment levels or hours worked in an economy). Output per hour is the purest measure of productivity, as it adjusts for changes in working hours such as more part-time working.
However, data – particularly historic data – on hours worked can be more difficult to find than the total number of people in work, so output per worker or output per job are also widely used. Changes in any of these variables will affect productivity.
For example, if GVA increases but hours worked remain unchanged, then productivity will also increase. However, if GVA remains unchanged but the total number of hours worked increases (for example if employment went up and average hours worked stayed the same) the result would be a fall in productivity – it took more hours to produce the same amount by value. It is important to note that changes in labour productivity may be driven by a number of other factors, such as the quality of leadership and the type of culture it establishes, the degree of automation and intensity of capital. Much of which have little to do with the innate qualities or efforts of employees.
For example, an increase in capital or developments in technology will increase the amount of output for a given labour input, thereby raising observed labour productivity.
The most common ratio is:
OUTPUT PER HOUR = REAL GROSS VALUE ADDED/TOTAL NUMBER OF HOURS WORKED
This is a monetary value divided by a physical value. In parts of the country such as the NE of England land values and house prices are lower than in the SE. Average wages are also lower. A pint of bitter costs nearly 100p more in the SE (around 25% more than the NE).
The consequence is that a barman in Durham selling exactly the same number of pints per hour of work as his counterpart in Woking will be 25% less productive according to the data. It is complete bollocks. And yet the government and the press persist in using the measure, so concluding that London and the SE is more productive than the North. Nonsense.
4a. Are the French more productive than the British?
A cursory glance at media comments gives a clear message: the French produce between 15 and 25% more than the Brits. Is this true or is it fake news?
France is almost identical to the UK in terms of economic output (measured using gross value added). The available labour force is the same at 30m.
In 2014 GDP per hour of work was $50.5 for the UK but $62.7 for France. Therefore the value of French output per hour of work is 25% higher. BUT the French minimum wage is 35% higher than the UK, so the value of output per hour will of course be higher. However, the consequence of higher minimum wages is lower demand for labour.
The level of French unemployment averages 1 million more than the UK.
80% of the UK’s available workforce are economically active, compared to 75% in France.
In France GDP per economically active person was $89,000. In the UK the figure is $78,000, a gap of 14%.
But if the French had the same level of employment (i.e. 80% economically active) the GDP per person would be $77,000.
Important conclusion: from a total national labour force perspective there is no productivity gap between France and the UK.
The reasons France appears to be more productive are an unemployment rate of 10% and a higher minimum wage.
If France could boost employment levels to the UK level without depressing wages then indeed they would be more productive.
Net migration in the UK is 2.56 per 1000; in France it is 1.09 per 1000. This suggests that the UK is more attractive as a destination for EU workers.
Since 2008 France and the UK have followed different paths to create the same sized GDP. The UK has gone for higher employment with lower productivity, the French for lower employment with higher productivity.
It should be noted that the average hours worked by full time employees in the UK are 42.7, and in France 41.1 hours.
The Brits blame the EU for low wages, the French blame the EU for high unemployment. And in both countries the political shift is based on a belief that leaving the EU will change
their economic prospects. Whereas it is the rise of Asia and its integration with the global economy which has created the economic circumstances of today as I have discussed in previous updates.
5. Our hospitals are overcrowded and stretched because of immigrants.
40% of the NHS budget is spent on people who are over 65, who number 11.5 million. They consume 65% of the drug budget. The number of beds has been reduced by 7000 since 2010, and 50% of those remaining are occupied by the over 65s.
The number of foreign born residents in the UK is 8 million. Half of the arrivals in recent years are under 25 years old.
20% of over 85 year olds use all three NHS services: A&E, outpatient and inpatient. And 66% of the admissions were emergency.
The chart shows % of live births to women born outside the UK. Midwifery services are stretched by this.
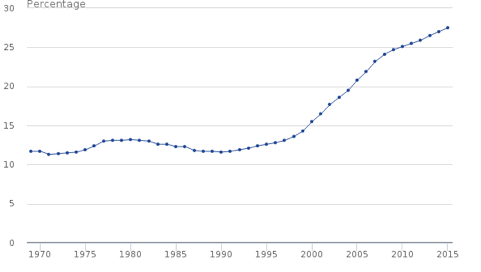
Number of live Births to Women born outside the UK: Source ONS
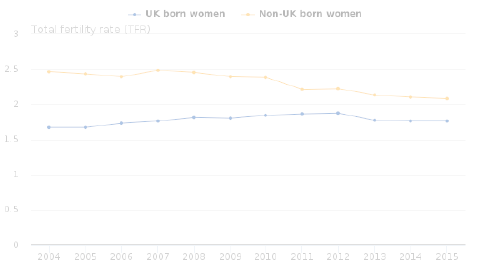
Foreign born females are more fecund than others, but as the next chart shows the gap is narrowing
6. The FTSE100 is at record highs because of outstanding leadership which justifies high rewards.
The FTSE is at record highs primarily because of the weakness of sterling against the dollar.
According to a 2016 survey, CFOs at the biggest listed companies received an uplift of more than £600,000 in their total average pay, to take them to £2.16m– up from £1.45m the previous year. Those in the FTSE 250 secured a less seismic, but still impressive, £100,000-plus boost to £1.25m, up from 2015’s £1.14m.
Such rises show that the UK’s top finance bosses have seen their personal fortunes more than double from the £975,038 average in 2009 for those in the FTSE 100 and £521,429 for those at the fiscal helm of the FTSE 250. Go back to 2003 and it has more than tripled from £682,979 and £387,865 respectively.
The average FTSE 100 chief executive earned more in the first two working days of 2016 than the average UK worker does all year. However the CEO was working 60 hours a week and 3 out of 4 weekends, whereas his employees were probably working 37.5 hours. But the gap between the bosses and their employees is widening.The average UK employee experiencing the longest continual period of a significant fall in real wages between 2007 and 2014 than at any time since 1865-7.
A well-run company will increase the real income of all its employees, by developing and investing in new products and services. Most FTSE 100 companies grow through acquisition, which does not require exceptional leadership. The evidence suggests that there is a cycle of acquisition followed by disposals, followed by acquisition.
Looking Ahead
In the USA the key to the growth forecast is the tax reduction promised plus the infrastructure spend and its financing. But as has been said before, many Americans have been energised by election of Trump and this will boost growth.
The French elections could produce Le Pen and with it possible mayhem, as she wants France to consider Frexit or at least to leave the euro. The latter would cause chaos.
Currently there is a huge flow of funds from ClubMed to the North. It is the consequence of the ECB QE process called target 2. Essentially investors sell their ClubMed sovereign debt to the ECB, and then invest the proceeds in German mutual funds. This is the socialisation of debt which Germany wanted to avoid.
Greece is back on the agenda with the IMF pushing for debt relief and Germany resisting.
And then there is Brexit. Currently the Bank of England still says it believes the hike in inflation will be a one off and will not warrant an increase in base rate. If broad money continues to grow then they will quickly change their tune. We will have to wait and see.
The good news is that the cyclical upswing still has momentum and will result in 2017 turning out well, all other things being equal. The bad news is that so much could go wrong so quickly, but that cannot be forecast.
The best advice is to focus on the things you can influence. What will be, will be.
Prepared March 3 2017
 Roger Martin-Fagg
Roger Martin-Fagg is an economist turned strategist.
A behavioural economist who focuses on behaviour and feedback loops which are largely absent from conventional models.
He began his career in the New Zealand Treasury, then moved into Airline Business Planning and teaching postgraduates all aspects of economics. He designed and ran the postgraduate diploma in Airline Management for British Airways before joining Henley Management College in 1987, where for 21 years he taught senior managers macroeconomics and strategy.
Roger is an independent teaching consultant. He has been external examiner to Bath University, worked with the Bank of England, three of the major UK clearing banks, advised a major London recording studio for 15 years, and regularly talks to SME owners in the UK and Europe about economic trends. He is a visiting fellow to Ashridge, Warwick and Henley business schools.
Roger is a practical researcher. He focuses on how the economy really works and on the links between FT100 reward systems, the behaviour of banks and economic instability. He also researches his clients trading environment as a necessary component of his teaching. His book
“Making Sense of the Economy” is in its fourth reprint.
He speaks at conferences around the world on the economic outlook and its impact on business. His quarterly Economic Update is sent to 1,200 SMEs.
Follow our social channels here: